What Is a Good Instagram Engagement Rate? Why Every Source Says Something Different
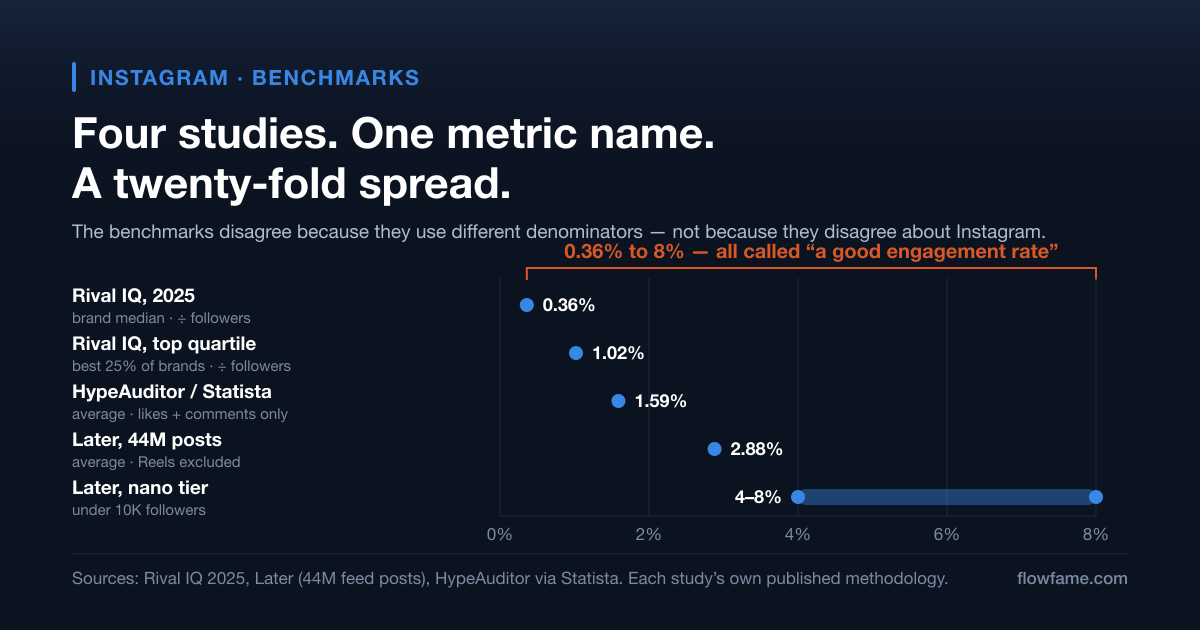
Published benchmarks put a good Instagram engagement rate anywhere from 0.36% to 8%. That is a twenty-fold spread for one metric. The gap is not disagreement about Instagram — it is four different formulas wearing the same name. Here is how to tell which benchmark your number can actually be compared to.
·9 min read
Engagement rate is the share of an audience that interacts with a post, written as a percentage. Reach is the number of unique accounts that saw it. Impressions are the number of times it was displayed, counting repeat views.
Those three definitions are where the trouble starts. Ask what counts as a good Instagram engagement rate and you get a confident answer. Ask twice and you get two.
Rival IQ reports a median of 0.36%. Later reports an average of 2.88%. Later's own table puts small accounts at 4% to 8%. Every one of those figures is real, published and sourced.
That is a twenty-fold spread for a single metric. It is not a research dispute. Those studies measured four different things and gave them all the same name.
This guide shows what each one actually measured. It covers what Instagram itself counts as engagement, which turns out to be narrower than almost every benchmark assumes. Then you can work out which number your own rate is comparable to.
Key takeaways
Instagram's own API defines engagement as likes and comments only. Saves and shares are not included in that metric.
Benchmarks differ mainly on the denominator. Dividing by reach gives a much higher figure than dividing by followers.
Brand accounts and creator accounts are separate populations. A brand median and an influencer average are not comparable.
Medians and averages are quoted interchangeably, and engagement is heavily skewed, so the average always sits higher.
Before comparing your rate to any benchmark, check its denominator, its numerator, its population and its date.
Why the published numbers disagree
Four studies rank on the first page of results for this question. Each is methodologically sound. Each answers a different question.
The table below puts them side by side with the detail their headlines leave out.
Source
Headline figure
Divided by
Counting
Measured on
Rival IQ, 2025 benchmark report
0.36% median
Followers
Engagements per post
Brand accounts, all industries
Rival IQ, top quartile
1.02% median
Followers
Engagements per post
Best-performing 25% of brands
Later, 44M feed posts
2.88% average
Followers
Post engagements
Feed posts, Reels excluded
HypeAuditor via Statista, 2023–24
1.59% average
Followers
Likes and comments only
Accounts above 1,000 followers
Reach-based formula
Typically highest
Reach
Likes, comments, saves, shares
Your own account only
The same metric name, four different measurements. Compiled from each study's own published methodology, September 2026.
Four things move independently in that table, and each one shifts the result:
The denominator. Followers, reach, impressions or views. Reach is almost always smaller than a follower count for accounts whose posts do not travel far. Dividing by the smaller number produces the bigger percentage.
The numerator. Some studies count likes and comments. Others add saves and shares. Saves and shares are a substantial share of interactions on Reels, so including them can roughly double a figure.
The population. Rival IQ measures brand accounts. The HypeAuditor data measures accounts above a thousand followers. Brands and creators behave differently, and brands engage worse.
Median or average. Rival IQ reports medians. Later and HypeAuditor report averages. Engagement is heavily skewed by a few viral outliers, so the average always lands above the median.
What Instagram itself counts as engagement
There is a first-party answer here, and it is narrower than most guides assume.
Instagram's own Platform insights documentation defines each metric it returns. The definitions below are Meta's own wording, not a paraphrase.
Metric
Instagram's own definition
engagement
Total number of likes and comments on the media object
reach
Total number of unique accounts that have seen the media object
impressions
Total number of times the media object has been seen
Metric definitions as returned by Instagram's insights API. Source: Instagram Platform insights documentation, Meta.
Read the first row again. Saves and shares do not appear in Instagram's own engagement metric.
That matters more than it looks. Every benchmark that counts saves and shares is measuring something Instagram does not call engagement. Neither convention is wrong. They are simply not interchangeable, which is exactly how they get used.
The distinction between reach and impressions matters too. Reach counts unique accounts. Impressions count every time the post was displayed, including repeat views by one person. Impressions are therefore always the larger number, and dividing by them produces the lowest rate of all.
Two limits Meta documents and almost nobody mentions
The same documentation records two constraints that quietly shape what you can measure.
Some metrics are unavailable below 100 followers. Meta states this outright. New accounts are not reading a low engagement rate; they are reading an incomplete one.
Account metrics are stored for up to 90 days. That is a hard ceiling on your own history. You cannot compute a year-on-year engagement trend from Instagram's data alone, because the data is gone. If you want a longer series, record your numbers monthly and keep them yourself.
Neither limit appears in the benchmark articles. Both change what a comparison is worth.
Benchmarks by follower tier, with their sources attached
Smaller accounts do genuinely engage at higher rates. That pattern holds across every study.
The size of the effect, though, depends entirely on whose numbers you read. Below are two published tier tables side by side. Note that they do not even use the same tier boundaries.
Tier
Later — feed posts, Reels excluded
HypeAuditor via Statista — likes and comments only
Nano
Under 10K: 4% – 8%
1K – 10K: 2.19%
Micro
10K – 100K: 2% – 4%
10K – 50K: 0.99%
Mid-tier
100K – 500K: 1.5% – 3%
50K – 500K: 0.86%
Macro
500K – 1M: 1% – 2%
500K – 1M: 0.87%
Mega
1M+: 0.5% – 1.5%
1M+: 0.94%
Two published tier tables for the same metric. Sources: Later and HypeAuditor via Statista. Tier boundaries differ between them, so rows are aligned approximately.
At the nano end the two sources differ by roughly three times. Both are published, both are cited widely, and both describe accounts under ten thousand followers.
The Statista dataset states its method plainly: likes and comments divided by followers, for accounts above 1,000 followers, covering 2023 to 2024. Later's figures come from its analysis of 44 million feed posts with Reels excluded.
Different numerator, different population, different years. The gap is the method, not the platform.
How to compare your own rate honestly
Four questions make any benchmark usable. Ask them before you compare anything.
1
What is it divided by?
Followers, reach, impressions or views. Only compare your rate to a benchmark using the same denominator. A reach-based rate will always flatter you against a follower-based one.
2
What does it count?
Likes and comments alone, or saves and shares as well. If the study does not say, treat it as likes and comments — that is what Instagram's own engagement metric returns.
3
Who was measured?
Brand accounts, creators, or all accounts above some threshold. Brands engage worse than creators, so a brand median sets a lower bar than an influencer average.
4
Median, average, or a range?
Engagement is skewed by outliers. The average sits above the median, so quoting one against the other overstates or understates the gap every time.
5
How old is it?
Instagram's format mix has shifted heavily towards Reels. A benchmark that excludes Reels describes a version of the platform that no longer dominates the feed.
To calculate your own figure, use the calculator below. It divides likes plus comments by followers, which is the convention Instagram's own engagement metric uses and the one the influencer benchmarks above are built on.
That makes its output directly comparable to the Statista tier column. It is deliberately not the reach-based formula, which produces a higher number that no public benchmark matches.
Calculate your Instagram engagement rate
$
Engagement rate
4.25%
Interactions per post
425
Calculated from the numbers you entered, using the by-followers definition that brands quote. We don't show a “good” benchmark to compare against: every published band traces back to one vendor's private dataset, and what counts as strong depends on your size and niche. Your own trend over time is the more useful comparison.
Engagement rate is useful for two jobs. It compares accounts of similar size, and it tracks one account over time.
It is weak at almost everything else. It says nothing about whether your audience buys. It falls naturally as an account grows, so a declining rate can accompany rising reach and rising revenue. Read alongside follower growth, it is easy to misread as decline.
Sprout Social's guidance is worth borrowing here: pick the formula that matches your goal, then hold it constant. A consistent imperfect measure beats switching methods each quarter. Their breakdown of the three formulas sets out when each one applies.
The trap worth naming is optimising the ratio itself. Posting less often raises your average engagement rate while reducing total engagement. The number improves and the account gets smaller.
Frequently asked questions
What is a good engagement rate on Instagram?
It depends on which benchmark you compare against. Against Rival IQ's brand data, anything above 1.02% puts you in the top quartile. Against HypeAuditor's influencer data, the all-tier average is 1.59%. Both use likes and comments divided by followers, so both are comparable to each other — and to the calculator on this page.
Why is my engagement rate so much higher in a third-party tool?
Almost certainly the denominator. Tools that divide by reach report a higher figure than tools dividing by followers, because reach is usually smaller than your follower count. Check which formula the tool uses before comparing its output to a published benchmark.
Do saves and shares count as engagement?
Not in Instagram's own metric. Meta's insights documentation defines engagement as the total number of likes and comments on the media object. Many analytics tools add saves and shares, which is defensible, but it produces a materially higher number than Instagram reports.
Why does my engagement rate drop as I gain followers?
Because followers are the denominator. New followers are typically less active than early ones, so the numerator grows more slowly than the divisor. Every tier table above shows this pattern, which is why comparing across sizes is misleading.
Can I see my engagement rate from last year in Instagram?
No. Meta's documentation states that account metrics data is stored for up to 90 days. Anything older is not retrievable from Instagram. If you want a long-run trend, record the figures yourself each month.
Why do my insights look incomplete on a new account?
Meta documents that some metrics are unavailable on accounts with fewer than 100 followers. Below that threshold you are not seeing weak performance, you are seeing suppressed reporting.
There is no single good engagement rate, and the sources are not careless for disagreeing. They measured different populations with different formulas and published honestly.
The practical move is to fix your own method and hold it. Use one formula, compare only to benchmarks built the same way, and track the trend rather than the absolute figure. If you are planning the posts themselves, our Instagram sizes guide covers the crops and safe zones that decide whether people see your content properly at all.
If your rate fell rather than your reach, check how Instagram counts a view before concluding anything — the 2025 metric consolidation moved the denominator under a lot of accounts. And if you suspect a penalty rather than arithmetic, our guide to recommendation eligibility shows how to check it in the app.
Written and fact-checked against each cited source in September 2026 by the FlowFame editorial team. Benchmarks are revised annually, so check the publication date on any figure before relying on it. Found something out of date? Contact us, and read more About us.
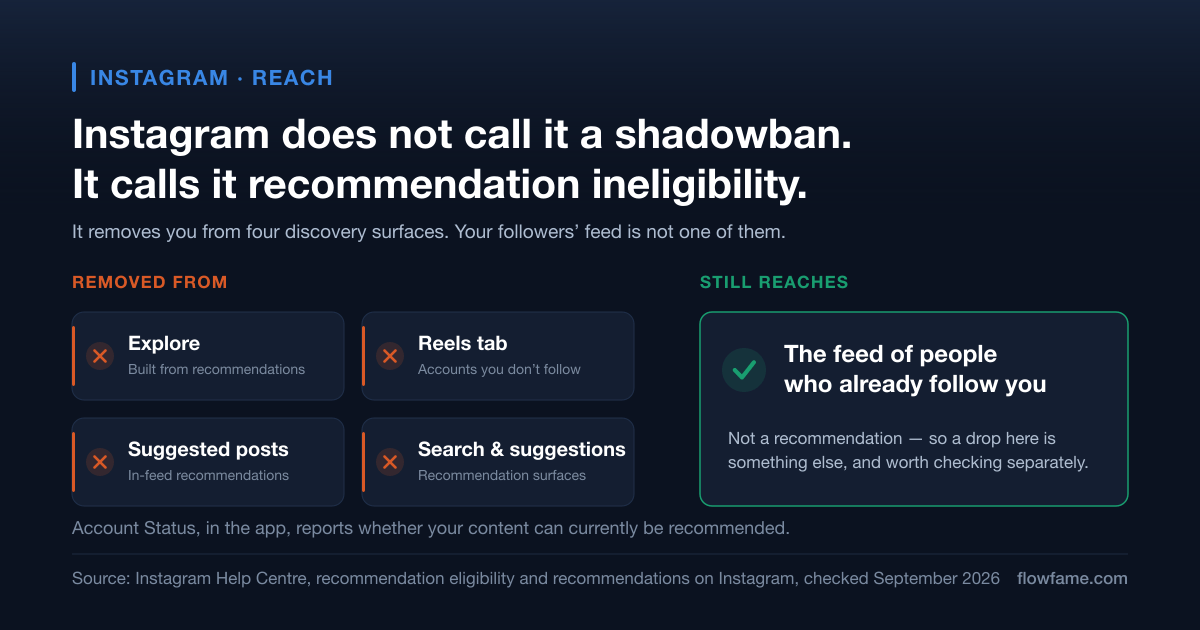
Instagram does not use the word shadowban, but something close to it exists, it is documented, and you can check it in about a minute. Here is the real mechanism, the in-app screen that reports it, and Meta's own published list of what puts an account on the wrong side of it.
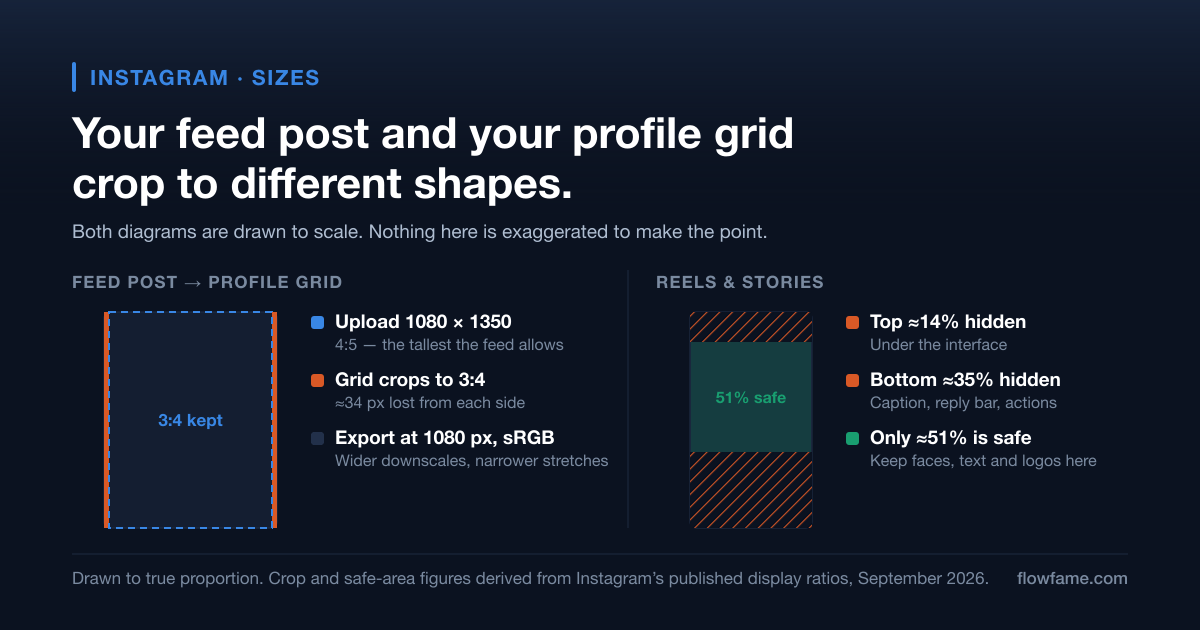
Every Instagram dimension that matters in one place — plus the part most size guides leave out: your feed post and your profile grid crop to different shapes, so a photo that looks right in one loses its edges in the other.